Precision at Every Voltage Level: Envolta’s Digital Fault Recording Implementation Transforms Power Quality Intelligence at a Metal Manufacturing Giant
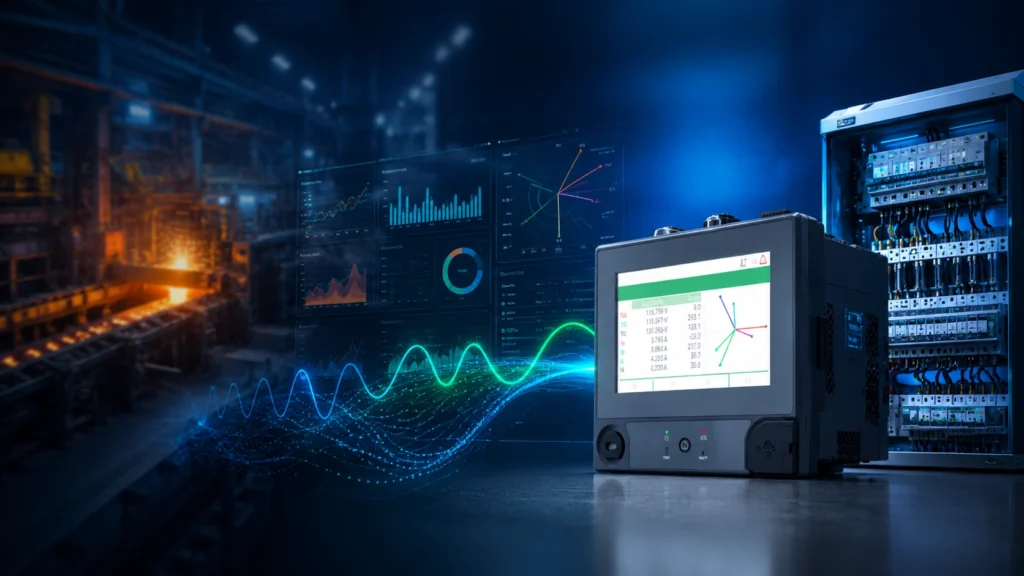
Precision at Every Voltage Level: Envolta’s Digital Fault Recording Implementation Transforms Power Quality Intelligence at a Metal Manufacturing Giant Introduction: Twenty Locations, One Unified View of Power Quality Metal manufacturing demands electricity on a scale that few other industries match. Electric arc furnaces, large rolling mills, induction heating systems, and heavy motor drives draw enormous currents — and the power quality events generated by these loads, combined with the vulnerability of precision process control systems to supply disturbances, create an environment where electrical monitoring is not a supporting activity but a core operational capability. For a renowned metal manufacturing facility operating across multiple voltage levels from a 220kV transmission line down to 415V low tension buses, the need for comprehensive power quality monitoring had become evident. Voltage sags, swells, and transients were occurring — at 20 monitoring locations — without a systematic means of recording, analyzing, or attributing them. Envolta Systems was commissioned to change this, and the result is one of the most comprehensive Digital Fault Recording implementations in the Indian metal manufacturing sector. The Client’s Electrical Infrastructure: Scale and Complexity The scope of this project began with understanding the facility’s electrical supply architecture — a multi-level power distribution system that extends from the high-voltage transmission incomer to the low-tension distribution level. Voltage Levels Covered 220kV Line — the high-voltage transmission incomer from the regional grid. 33kV Bus — primary distribution bus at the main substation level. 6kV Bus — medium voltage distribution serving large process equipment. 11kV Bus — medium voltage distribution for additional major loads. 11kV TG — on-site generation or captive power connection. 3kV Bus — secondary medium voltage distribution. 415V LT Bus — low tension distribution for motors, lighting, and auxiliary systems. Monitoring power quality events across all these voltage levels simultaneously — capturing the interaction between events at different levels and the transmission of disturbances through the transformer hierarchy — required a sophisticated, centrally integrated solution. The Solution: Schneider ION9000 at the Core Envolta Systems specified the Schneider Electric ION9000 as the primary power quality measurement instrument for this implementation — a selection that reflects both the technical requirements of the project and the capability standard required for this class of installation. Why the ION9000 The Schneider ION9000 is a high-performance power quality meter designed specifically for applications demanding high-resolution waveform recording. At 1024 samples per cycle — four times the resolution of standard power quality analysers — it captures the fine structure of voltage sags, swells, and transients with a level of detail that is essential for accurate fault analysis and disturbance source attribution. System Architecture Schneider ION9000 meters installed at all 20 monitoring locations across the facility’s voltage hierarchy. All meters integrated with a central server running Schneider Electric’s EcoStruxure Power Monitoring Expert (PME) software with the Power Quality Module enabled. Envolta Systems developed the final application — configuring PME for the specific monitoring requirements of this facility, including custom reporting, alarm thresholds, and event classification. What the System Delivers: Five Key Capabilities Detailed Event Recording — every occurrence of voltage sag, swell, or transient at any of the 20 monitoring points is captured with full waveform detail, timestamp, and duration data. Disturbance Direction Detection — the system identifies whether each disturbance event originated from the utility supply side or from within the plant’s own electrical system, enabling targeted and efficient maintenance or utility escalation. Power Quality Breakdown Summary — the PME Power Quality Module categorizes and summarizes events by type and frequency, enabling trend analysis and priority setting for remediation activities. Power Quality Impact Location Analysis — identifies which monitoring points experienced the greatest impact from each event, helping correlate production disruptions with specific electrical disturbances. Timeline Analysis — the system’s timeline view enables correlation of multiple events across different monitoring locations, revealing the propagation path of disturbances through the facility’s electrical network. Key Highlights 20 monitoring locations covered across voltage levels from 220kV to 415V LT. Schneider ION9000 meters providing 1024 samples per cycle — the highest recording resolution in the class. Integrated with EcoStruxure Power Monitoring Expert and Power Quality Module. Continuous monitoring of Voltage Sag, Swell, and Transient events with automatic recording. Disturbance Direction Detection — distinguishing utility-side from plant-side events. Power Quality Impact Location analysis enabling targeted remediation and process correlation. Envolta EcoXpert Power Management certification — Schneider-certified engineering and commissioning. Expert Insights: Power Quality Monitoring at Industrial Scale Implementing comprehensive power quality monitoring across a complex multi-voltage industrial facility of this scale presents challenges that are simultaneously technical, logistical, and analytical. On the technical side, the selection of instruments with sufficient measurement resolution to capture fast transients — the ION9000’s 1024 samples per cycle is critical here — and the design of a communication architecture that can reliably transmit measurement data from 20 distributed points to a central server, is a non-trivial engineering exercise. From an operational analytics perspective, the value of the EcoStruxure PME Power Quality Module lies in its ability to transform raw event data into structured, actionable intelligence. A raw list of 200 voltage sag records over a quarter has limited management value. A summary showing that 87% of sags originate from the utility side at specific hours correlated with regional grid loading — with a timeline showing propagation from the 220kV incomer through the 33kV bus to the 6.6kV level within milliseconds — is actionable intelligence that management can use to engage the utility, adjust production scheduling, or specify protective equipment for sensitive loads. SEO Section: Industrial Power Quality Monitoring and DFR Systems Key search queries relevant to this project include: digital fault recording system industrial, Schneider ION9000 power quality meter, EcoStruxure power monitoring expert implementation, voltage sag monitoring 220kV industrial, power quality analysis metal manufacturing, 20 point power quality monitoring industrial. Semantic keywords: continuous power quality monitoring plant, power disturbance direction detection, waveform recording industrial substation, fault analysis EcoStruxure PME, Schneider EcoXpert power management India. Conclusion: Empowering Reliability, Improving Efficiency, Enabling Smarter Decisions The deployment of a 20-location Digital Fault
Return on Investment in Under 5 Months: Envolta’s Energy Conservation Drive Delivers ₹17 Lakhs Annual Savings at a Vadodara Chemical Plant

Return on Investment in Under 5 Months: Envolta’s Energy Conservation Drive Delivers ₹17 Lakhs Annual Savings at a Vadodara Chemical Plant Introduction: Energy Costs Are a Business Decision, Not Just a Technical One Ask the finance director of any chemical manufacturing company in India what keeps them up at night, and energy costs will almost certainly feature prominently in the answer. Electricity is one of the largest variable costs in chemical processing — and unlike raw material costs, which fluctuate with commodity markets, energy costs are substantially within the control of a well-managed facility that has invested in identifying and acting on conservation opportunities. This is the premise behind Envolta Systems’ Energy Conservation Drive: a systematic, engineering-led assessment of a facility’s energy consumption patterns, designed to surface quantified savings opportunities with calculated return on investment — not recommendations in the abstract, but specific proposals with financial projections that management can evaluate and act on. At a renowned chemical manufacturing facility in Vadodara, this approach delivered results that dramatically exceeded the cost of the engagement. The Objective: Finding Savings That Can Be Proven, Not Just Promised The mandate Envolta Systems received from this chemical industry client was clear: identify energy savings opportunities with ROI calculations. Not a general audit report with broad recommendations, but a focused, quantified investigation that would give management the financial basis to make investment decisions with confidence. This framing matters. Energy audits that produce long lists of recommendations without financial projections are frequently filed and forgotten. Audits that arrive with specific project proposals, investment requirements, and payback calculations are implemented. Envolta’s approach was designed specifically to produce the latter. The Methodology: Five Steps from Plant Floor to Boardroom Presentation Conducted a detailed field study at the chemical plant — physically walking down every significant energy-consuming system, from motors and compressed air to lighting, HVAC, and utility systems. Collected comprehensive Electrical and Utility data — gathering metered consumption data across all major load categories to establish an accurate baseline for analysis. Analyzed data to identify energy-saving opportunities — applying engineering analysis to identify the gap between current performance and achievable best practice across each system. Prepared a detailed report with 7 distinct proposals, each including ROI calculations — giving management a menu of investment options, from the quickest-payback to the highest-absolute-savings projects. Presented the findings to the client — walking the management team through each proposal with the financial projections, enabling informed, confident decision-making. The Results: Numbers That Make a Compelling Case Total Investment Required: ₹7 Lakhs — the combined capital expenditure across the recommended energy conservation measures. Annual Savings Delivered: ₹17 Lakhs per year — the recurring reduction in energy costs resulting from implementation. Overall ROI Period: Under 5 months — the time required for the annual savings to fully recover the initial investment. To place these numbers in context: a ₹7 Lakh investment that generates ₹17 Lakh per year delivers a return of approximately 243% per year on an ongoing basis after payback. In a chemical manufacturing context where investment decisions are frequently evaluated against hurdle rates of 20–30%, an energy conservation project with this payback profile is an exceptionally compelling financial proposition. What Seven Proposals Look Like in Practice While the specific proposals at this facility are proprietary to the client, the categories of energy saving opportunity typically identified in chemical plant audits of this type include: motor efficiency optimization and load-right-sizing, compressed air system leak detection and pressure management, power factor correction and harmonic mitigation, lighting upgrades to LED technology, HVAC and cooling tower optimization, energy metering for accountability and monitoring, and process heat recovery opportunities. Each of these represents a distinct investment with a distinct payback period — and providing them as a menu allows management to sequence implementation based on available capital and operational priorities. Key Highlights Total investment of ₹7 Lakhs generating ₹17 Lakhs per year in annual energy savings. Overall ROI achieved in under 5 months — an exceptional return by any investment evaluation standard. 7 distinct proposals provided, each with individual ROI calculations for management decision-making. Methodology includes field study, data collection, engineering analysis, and formal management presentation. Demonstrates Envolta’s multi-disciplinary service capability — from energy audit to implementation across all conservation measures. Additional services offered: Power Quality Audit, Arc Flash Study, On-Site Meter Calibration, Thermography, and Energy Audit. Expert Insights: Why Energy Conservation Audits Belong in Every Industrial Budget From an industrial energy management perspective, the structured energy conservation study — as opposed to an informal energy review — represents a qualitatively different level of analytical rigour. The formal methodology of data collection, baseline establishment, opportunity quantification, and ROI calculation is what separates actionable savings identification from advisory commentary. For chemical manufacturing in India specifically, the macro-economic context makes this type of engagement increasingly urgent. Industrial electricity tariffs in Gujarat and across India have trended upward consistently, driven by rising generation costs, grid infrastructure investments, and regulatory changes. A facility that reduces its energy consumption by even 10–15% through conservation measures effectively locks in a cost advantage that compounds every time tariffs increase. The sub-5-month payback achieved at this Vadodara chemical plant is at the impressive end of the spectrum, but payback periods of 6–18 months are typical for well-executed energy conservation programs in Indian chemical manufacturing — a range that easily clears the investment hurdle rates of virtually any industrial management team. SEO Section: Energy Conservation in Indian Chemical Manufacturing Key search terms for this service include: energy conservation audit chemical plant India, energy saving ROI calculation industrial, energy audit Vadodara chemical industry, Envolta energy audit services, industrial energy efficiency audit Gujarat. Semantic keywords: energy savings opportunities chemical manufacturing, ROI energy conservation project, electrical data collection industrial audit, power factor harmonic energy audit, energy cost reduction chemical plant India. Conclusion: The Most Profitable Investment in Your Plant This Year For industrial decision-makers who assess capital expenditure proposals by their financial returns, an energy conservation study with a sub-5-month payback deserves serious attention — not as a
One Watt at a Time: Envolta Systems Resolves VFD Failures and Harmonic Non-Compliance at a Leading Cable Manufacturer in Vadodara
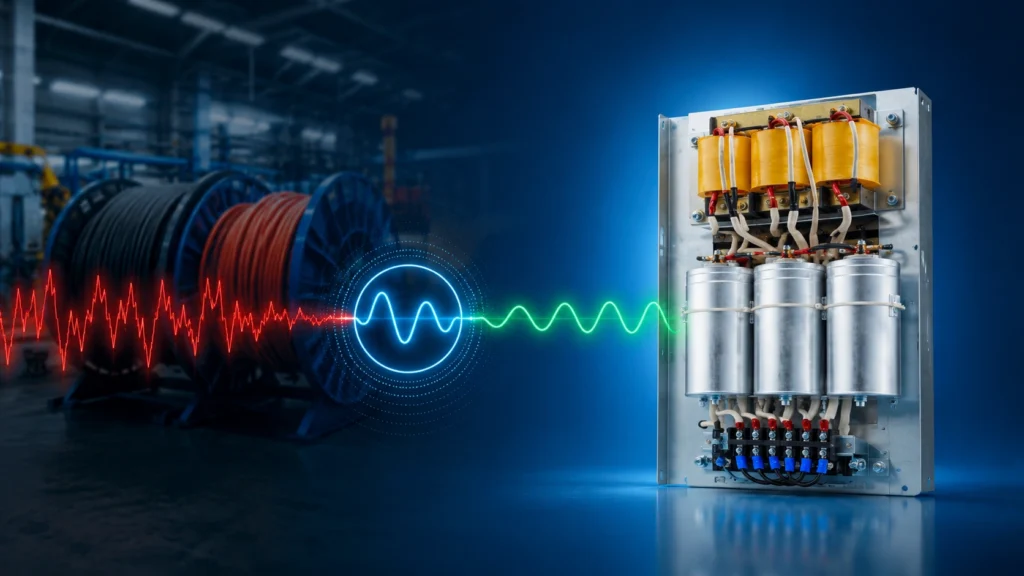
One Watt at a Time: Envolta Systems Resolves VFD Failures and Harmonic Non-Compliance at a Leading Cable Manufacturer in Vadodara Introduction: When VFD Failures Become a Production Pattern Variable Frequency Drives are the workhorses of modern cable manufacturing. They control the speed of Buncher Machines with sub-millisecond precision, regulate the feed rate of Insulation Feeders, and enable the kind of repeatable, controllable production quality that differentiation in the cable market demands. But VFDs also generate harmonics — and in a facility where multiple VFDs operate simultaneously without adequate harmonic mitigation, those harmonics feed back into the electrical system and begin destroying the very equipment that generates them.For a renowned cable manufacturer in Vadodara, this cycle had become a production management challenge. Frequent VFD failures were disrupting output, maintenance costs were rising, and an energy and harmonic audit revealed that the plant’s electrical system was operating well outside IEEE 519-2022 compliance standards. Envolta Systems was engaged to break this cycle — and did so with a precision-engineered harmonic mitigation solution tailored to the specific machines and loads at this facility. The Challenge: A Multi-Dimensional Power Quality Problem Envolta’s energy and harmonic audit at the Vadodara cable facility revealed a set of interconnected power quality issues that collectively explained the pattern of VFD failures and equipment degradation the client had been experiencing. Issues Identified During the Audit Frequent VFD Failures — the most visible symptom, with maintenance teams spending significant time and cost on drive replacements and repairs. High Current Harmonics (THDi) — current harmonic distortion levels significantly exceeding IEEE 519-2022 limits at the affected machines. High Voltage Harmonics (THDv) — voltage distortion resulting from current harmonics flowing through system impedances, affecting all connected equipment. Poor Power Factor — reactive power demand adding to utility charges and reducing effective electrical capacity. Non-compliance with IEEE 519-2022 — exposing the facility to potential contractual and regulatory issues with the utility. Affected Machines Buncher Machine — a critical piece of production equipment responsible for stranding multiple wire conductors together. Insulation Feeder — responsible for controlling the feed rate and tension of insulation material in the cable extrusion process. The Solution: Purpose-Built Harmonic Filters for Each Machine Rather than applying a generic plant-level solution, Envolta Systems designed machine-specific harmonic filters for each of the affected loads — recognizing that the harmonic profile of a Buncher Machine and an Insulation Feeder differ in frequency content and magnitude, and that a one-size-fits-all approach would deliver sub-optimal results. Filters Installed Harmonic Filter for the Buncher Machine — designed to the specific harmonic profile of this machine’s VFD drive system. Harmonic Filter for the Insulation Feeder — similarly tailored to the harmonic characteristics of this load. Both filters were wall-mounted in an IP42-rated enclosure — suitable for the industrial environment — and specified for rapid response to fluctuating loads, reflecting the dynamic nature of cable manufacturing production cycles. The Results: Machine by Machine, the Numbers Tell the Story Buncher Machine THDi reduced from 25% to 4.7% — a 81% reduction, bringing the machine into full IEEE 519-2022 compliance. THDv reduced from 5.4% to 3.9% — a meaningful improvement in supply voltage quality. Power Factor improved from 0.924 to 0.984 — near-unity correction from a relatively poor baseline. Insulation Feeder THDi reduced from 33% to 3% — a 91% reduction, one of the strongest THDi improvement results achievable with passive filter technology. THDv reduced from 5.8% to 4.3% — a measurable improvement in voltage quality at this machine’s supply point. Power Factor improved from 0.986 to 0.988 — marginal but consistent improvement confirming filter performance. Overall Achievement IEEE-519 Harmonic Limits achieved across all measured parameters. THDi below 5% for both machines — the IEEE 519-2022 general compliance limit. THDv below 5% for both machines — within acceptable voltage distortion limits. Power Factor improved to 0.985+ — near-unity at both machine points. Increased Equipment Reliability — a qualitative outcome confirmed by the cessation of recurring VFD failures following filter installation. Key Highlights Machine-specific harmonic filter design for Buncher Machine and Insulation Feeder. THDi reduction of up to 91% at the Insulation Feeder — from 33% to 3%. Full IEEE 519-2022 compliance achieved across all measured parameters. Power Factor improved to 0.985+ — eliminating reactive power penalty charges. IP42 wall-mounted design suitable for industrial manufacturing environments. Rapid response specification accommodating fluctuating production load profiles. End of recurring VFD failures — the primary business outcome driving the engagement. Expert Insights: Why Machine-Level Harmonic Filtering Outperforms Plant-Level Solutions The decision to deploy machine-specific harmonic filters, rather than a single plant-level solution, reflects an engineering philosophy that has consistently proven more effective in cable manufacturing environments. The reason is straightforward: harmonic generation in a manufacturing plant is not uniform. Different machines generate different harmonic spectra, at different times, at different current levels. A filter designed to treat the aggregate harmonic load of an entire plant is necessarily a compromise that performs sub-optimally for every individual load. By contrast, a filter designed specifically for a Buncher Machine — with its known VFD type, load characteristics, and harmonic profile — can be tuned precisely to the dominant harmonic frequencies that machine generates, delivering significantly better attenuation with less filter capacity than a generic solution would require. This approach also localizes the harmonic problem: by treating harmonics at the source, the filter prevents them from propagating into the network and affecting other equipment. The IP42 enclosure rating is also worth noting. Cable manufacturing environments involve mechanical dust and fiber particles that can infiltrate poorly sealed enclosures and cause filter component failures. A proper IP rating, matched to the installation environment, is an engineering detail that determines long-term filter reliability. SEO Section: Harmonic Compliance in Cable Manufacturing Key search terms for this project include: VFD harmonic filter cable industry, IEEE 519-2022 compliance manufacturing, harmonic mitigation Vadodara, Buncher Machine harmonic filter, THDi reduction cable manufacturing, power factor improvement VFD application. Semantic keywords: passive harmonic filter industrial VFD, current harmonic distortion solution, cable manufacturing power quality, IEEE 519 harmonic limit compliance
Silencing the Hum: How Envolta’s Harmonic Mitigation Strategy Transformed Electrical Health at a Renowned Chemical Industry
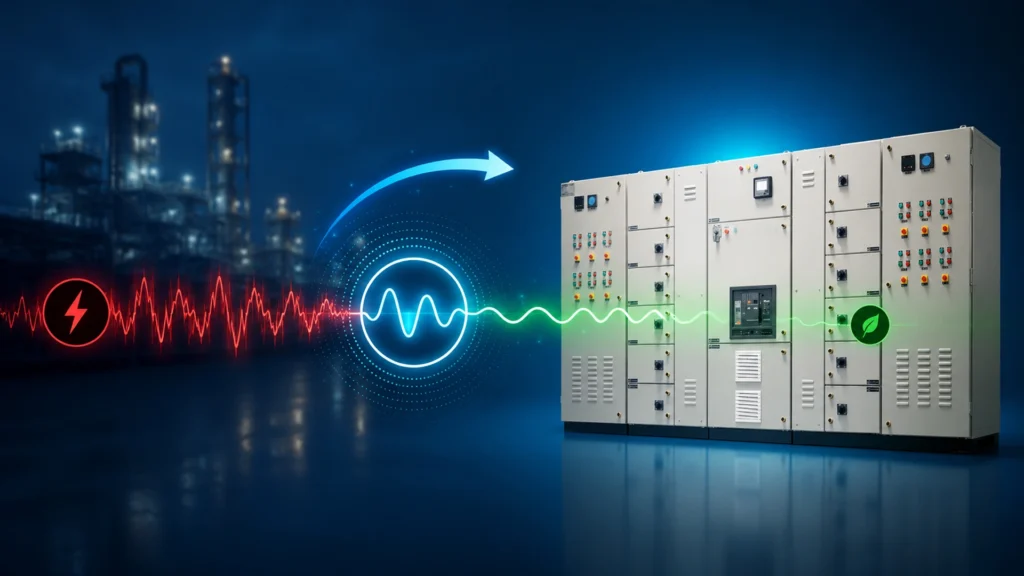
Silencing the Hum: How Envolta’s Harmonic Mitigation Strategy Transformed Electrical Health at a Renowned Chemical Industry Introduction: When the Transformer Hummed Too Loud There is a sound that experienced plant electrical engineers have learned to take seriously: a low, persistent humming from transformers and bus ducts that deepens over time, punctuated by the irregular failures of capacitors and motor windings. It is the sound of harmonic distortion — a complex electrical problem that, if left unaddressed, progressively degrades every piece of connected equipment until failures become not a question of if, but of when.At one of India’s renowned chemical industry facilities, this scenario had become a genuine operational crisis. The client was experiencing a constellation of symptoms — transformer humming, bus-duct noise, frequent motor winding burnouts, electronic card failures, and overheating power cables — that were individually disruptive and collectively pointing to a systemic harmonic problem of serious magnitude. Envolta Systems was engaged to diagnose the root cause and deliver a lasting solution. What the Client Was Experiencing: Five Warning Signs of Harmonic Distortion Transformer Humming Noise — a symptom of harmonic flux in the transformer core, indicating that harmonic currents were circulating at levels high enough to cause audible vibration. Bus-Duct Humming Noise — harmonic currents in bus-duct conductors cause mechanical vibration and noise, accelerating insulation fatigue. Frequent Motor Winding Burnouts — harmonic currents cause additional heating in motor windings, significantly reducing insulation life and causing premature failure. Electronic Card Failures — sensitive control electronics are highly susceptible to harmonic distortion in the supply voltage, which causes component stress and failure. Overheating of Power Cables — harmonic currents have a higher effective frequency than the fundamental, increasing cable resistance (skin effect) and generating disproportionate heat. The Diagnostic Findings: Why the Existing APFC System Was Making Things Worse Envolta’s engineering team conducted a comprehensive Harmonic Analysis and System Impedance Calculation — not merely measuring the harmonic levels present, but diagnosing the interaction between the existing APFC panel and the plant’s network impedance. The findings were revealing: the existing APFC panel’s capacitors and reactors, which had been operating for some years, had experienced a shift in the LC Tuning Factor. This meant that rather than presenting a high impedance to harmonic frequencies as designed, the degraded components were actually amplifying certain harmonics — a condition known as harmonic resonance, in which the network creates a feedback loop that concentrates harmonic energy rather than dissipating it. Specific Observations Confirmed by the Audit Overheating and humming noise from the reactor within the APFC Panel — confirming excessive harmonic current through the reactor. Frequent capacitor failures — consistent with harmonic-induced stress on capacitor dielectric materials. LC Tuning Factor shift — evidence that the existing filter components had drifted from their design specifications, causing harmonic amplification. Risk of fire in the APFC Panel due to reactor overheating — a safety hazard demanding immediate action. Envolta’s Solution: A Four-Stage Engineering Response The solution Envolta designed addressed both the immediate safety risk and the underlying harmonic problem through a systematic, staged approach. Stage 1 — Harmonic Analysis and System Impedance Calculations: Comprehensive measurement and modeling to characterize the harmonic spectrum and identify the specific tuning frequencies required for the replacement LC filters. Stage 2 — Designed Solution: Engineering of custom LC filters tuned to the appropriate harmonic frequencies for this specific plant configuration — not generic off-the-shelf components, but site-specific filter elements calculated to suppress the dominant harmonics without creating new resonance conditions. Stage 3 — APFC Panel Retrofitting: Old capacitors and reactors were removed and replaced with the newly designed LC filter elements within the existing APFC panel enclosure — minimizing infrastructure disruption. Stage 4 — Measurement and Verification Post-Execution: Post-commissioning harmonic measurements to confirm that the installed filters were performing as designed and that harmonic levels had been reduced to acceptable limits. The Results: Five Compelling Outcomes Harmonic amplifications completely avoided — the new LC filters present the correct impedance at harmonic frequencies, eliminating the resonance condition. Harmonic level reduced by 50% — a dramatic improvement in the plant’s power quality environment. Reduced maintenance and operating cost — with harmonic-induced equipment stress eliminated, the failure rates of motors, capacitors, and electronic equipment have fallen significantly. Zero downtime observed since commissioning — the plant has operated without harmonic-related production disruptions since the retrofitting was completed. Risk-free operation of the APFC Panel — with correctly tuned components and appropriate thermal management, the fire risk has been eliminated. Additionally, Envolta provides a 3-year Product Guarantee and Performance Guarantee on the installed solution — demonstrating confidence in the engineering quality and durability of the work delivered. Key Highlights Comprehensive harmonic audit and system impedance analysis before any solution was specified. Custom LC filter design addressing the specific harmonic profile and network impedance of this chemical plant. APFC panel retrofitting — old capacitors and reactors replaced with correctly tuned filter elements. 50% reduction in harmonic levels — a substantial improvement in plant-wide power quality. Zero production downtime since commissioning — the benchmark result of a well-executed harmonic mitigation project. 3-year Product and Performance Guarantee — demonstrating commitment to long-term solution quality. Elimination of fire risk in the APFC Panel through correct component specification and installation. Expert Insights: The Hidden Complexity of APFC Harmonic Interaction The scenario encountered at this chemical plant illustrates one of the most technically nuanced aspects of industrial power quality management: the interaction between existing APFC systems and harmonic-generating loads. Many industrial facilities install APFC panels to address power factor compliance without conducting a detailed harmonic analysis. When the harmonic content is high, capacitor banks can create parallel resonance conditions with the network inductance — resonances that amplify specific harmonics rather than attenuating them.The aging and drift of reactor and capacitor components over time makes this problem progressively worse, as the detuning of a filter that was initially acceptable can eventually create a resonance condition at a particularly harmful harmonic frequency. This is precisely what occurred at this chemical plant, and it is a pattern that
